The IPIS Open Data dashboard on artisanal and small-scale mining (ASM) in the eastern Democratic Republic of the Congo (DRC) enables users to query and subset IPIS Open Data using various combinations of filters. The dashboard was designed to complement the IPIS Webmap of DRC, providing key visuals to enhance understanding of the ASM sector in eastern DRC.
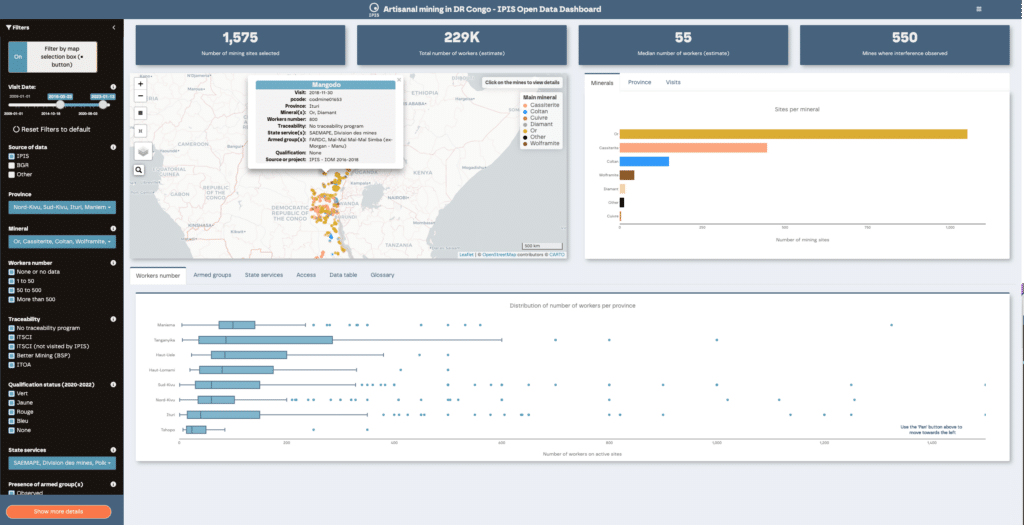
The different visual elements of the dashboard – i.e. a map of mining sites, key figures, graphs and charts on ASM sector – are reactive and reload each time a filter is adjusted.
The filters are available in the left sidebar as slider control, tickbox and dropdown menu filters. They allow subsetting IPIS Open Data by: date of visit, source of data, province, mineral, number of workers per mining site, access to the mining site, mineral traceability, official qualification status, presence of state services, armed groups, as well as reported armed interference, presence of child labour and mercury use. Any mining site that does not meet the filter’s criteria will disappear from the map and will not contribute towards the key figures and graphs.
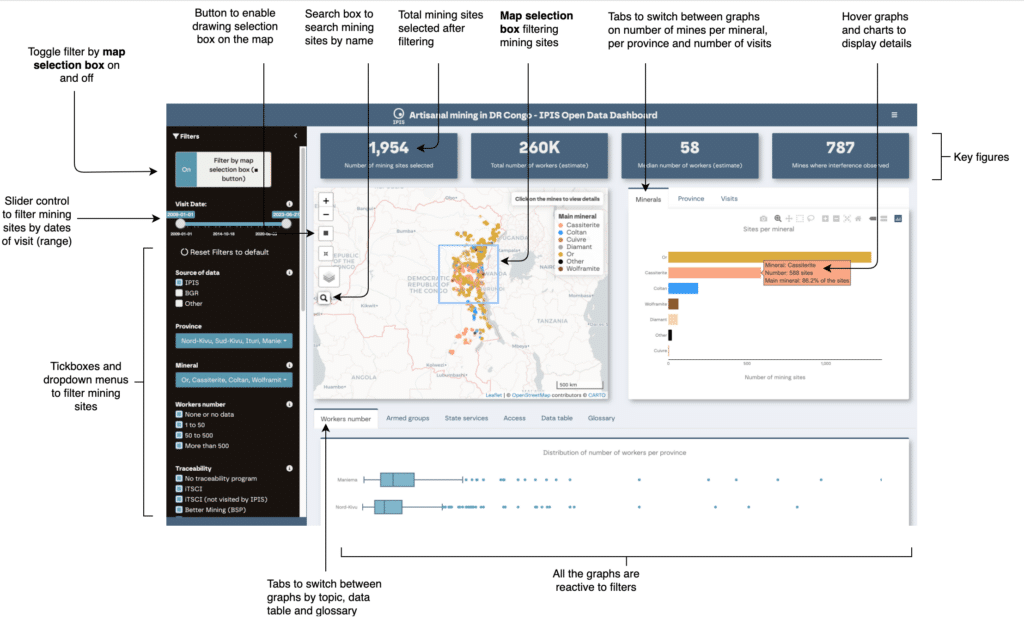
Figure 1. Key elements of the IPIS Open Data dashboard on ASM in eastern DRC.
The sites visited by IPIS are selected by default since these provide the most comprehensive source of data for mining sites in the Open-Data. Using a tickbox filter, the dashboard also allows users to select additional mining sites for which the location was shared by IPIS partners but which have not always been visited by IPIS. In the latter case, information on types of minerals per mine are provided, as well as occasional data on workers number and traceability programmes.
Some special features of the interactive dashboard include:
- Possibility to spatially filter IPIS Open Data by manually drawing a selection box on the map. To enable this, the ‘filter by map selection’ box must be toggled to the ‘On’ position, which is the default. To deactivate the box filtering, users can click the button to move it to the ‘Off’ position. If a selection has been made previously, the box will reappear once the switch is returned to ‘On’ and the data will be filtered accordingly. To draw a box, users can click on the square symbol (■) and then click and drag on the map to create the box. The key figures boxes and graphs will then reload, only including data from any mining sites contained within this box.
Figure 2. Map selection box. When enabled (‘On’), the map selection box allows geographical filtering of the data by drawing a selection box on the map.
- Mining sites can be searched on the map by their name. The search function automatically opens a pop-up window providing detailed data on the site of interest. The pop-up window can also be triggered by clicking directly on the map on the site of interest.
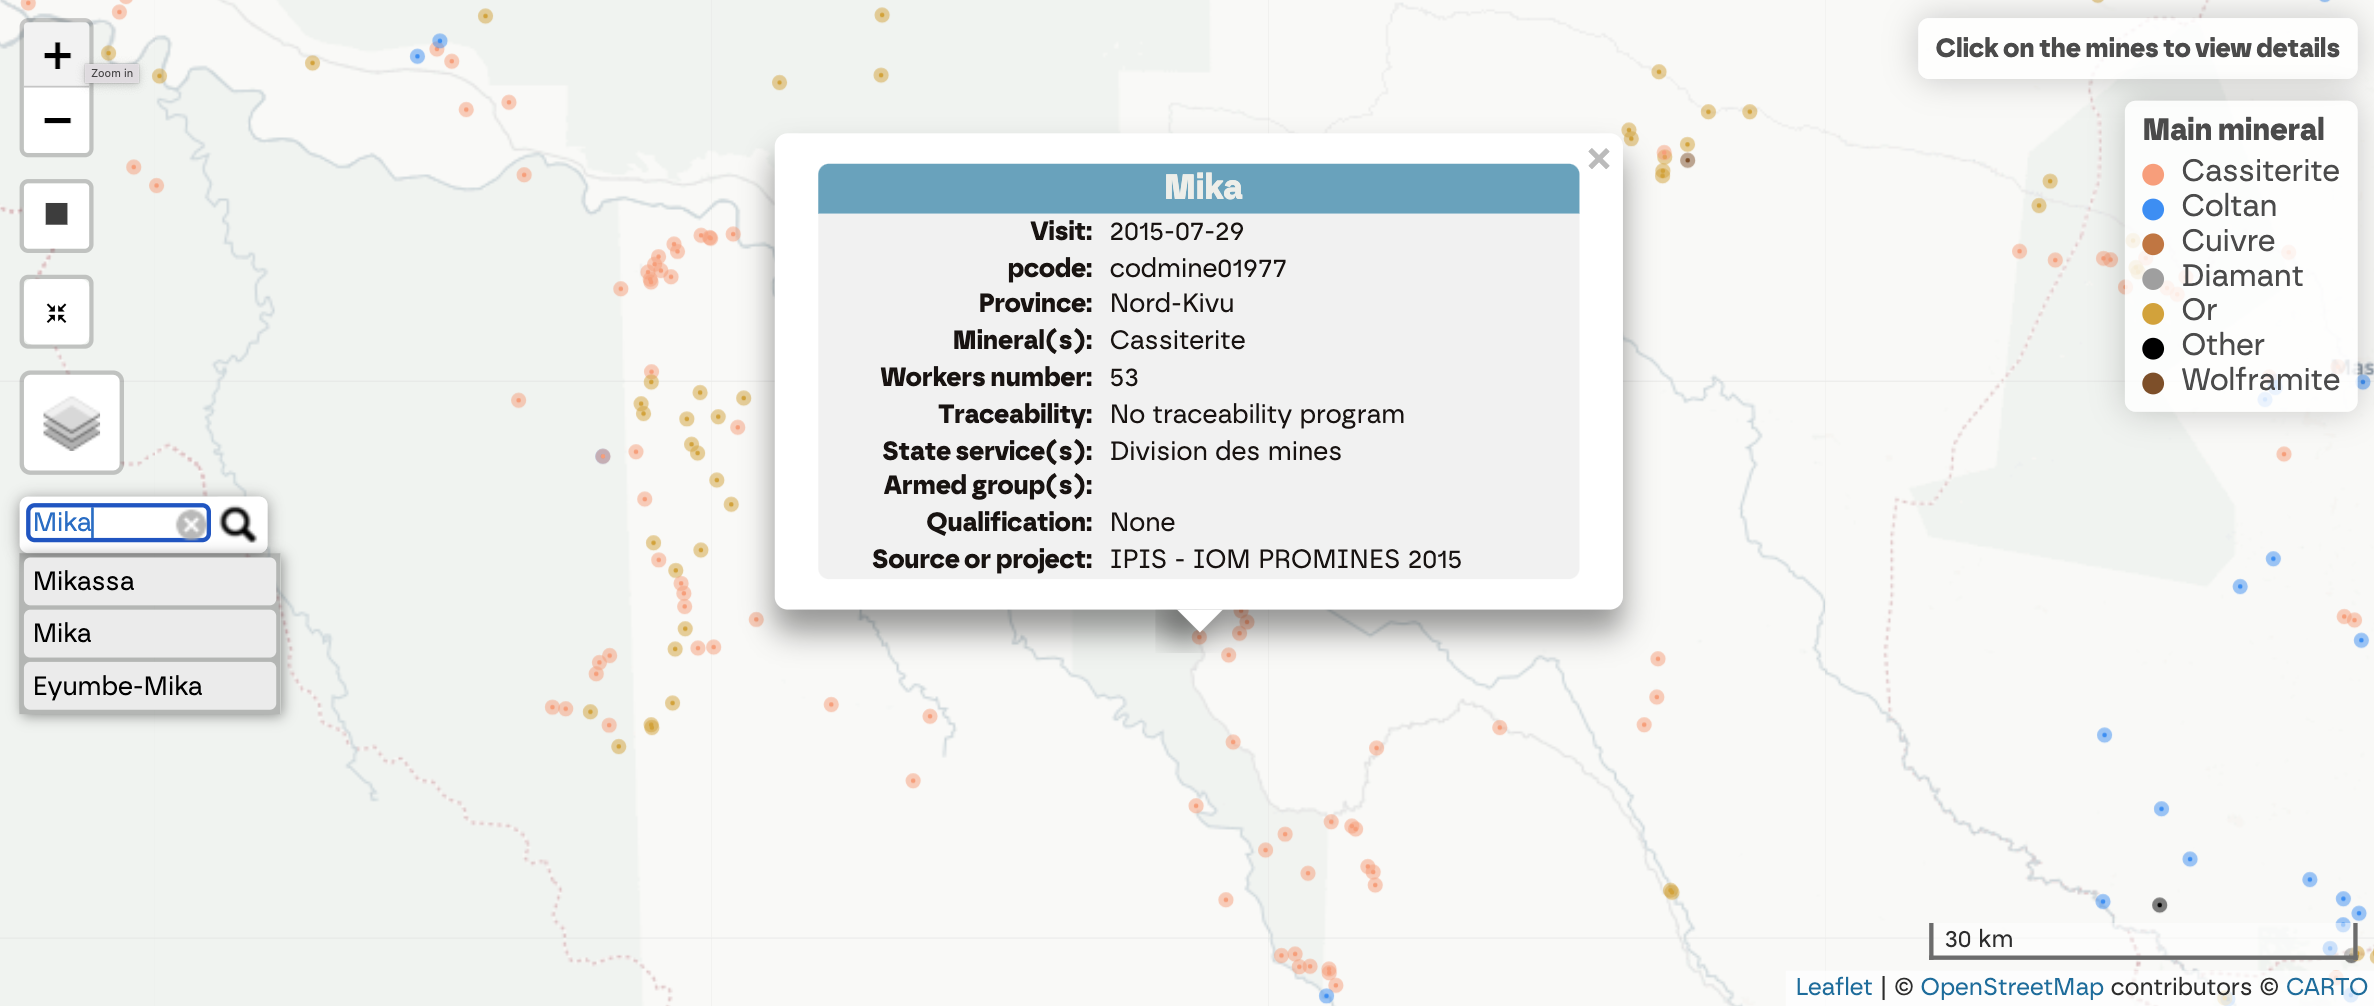
Figure 3. Search box and pop-up window. The search box allows to search by site name; the pop-window appears by clicking on a mining site on the map or after a search.
- Additional information on graphs and charts are available on hover
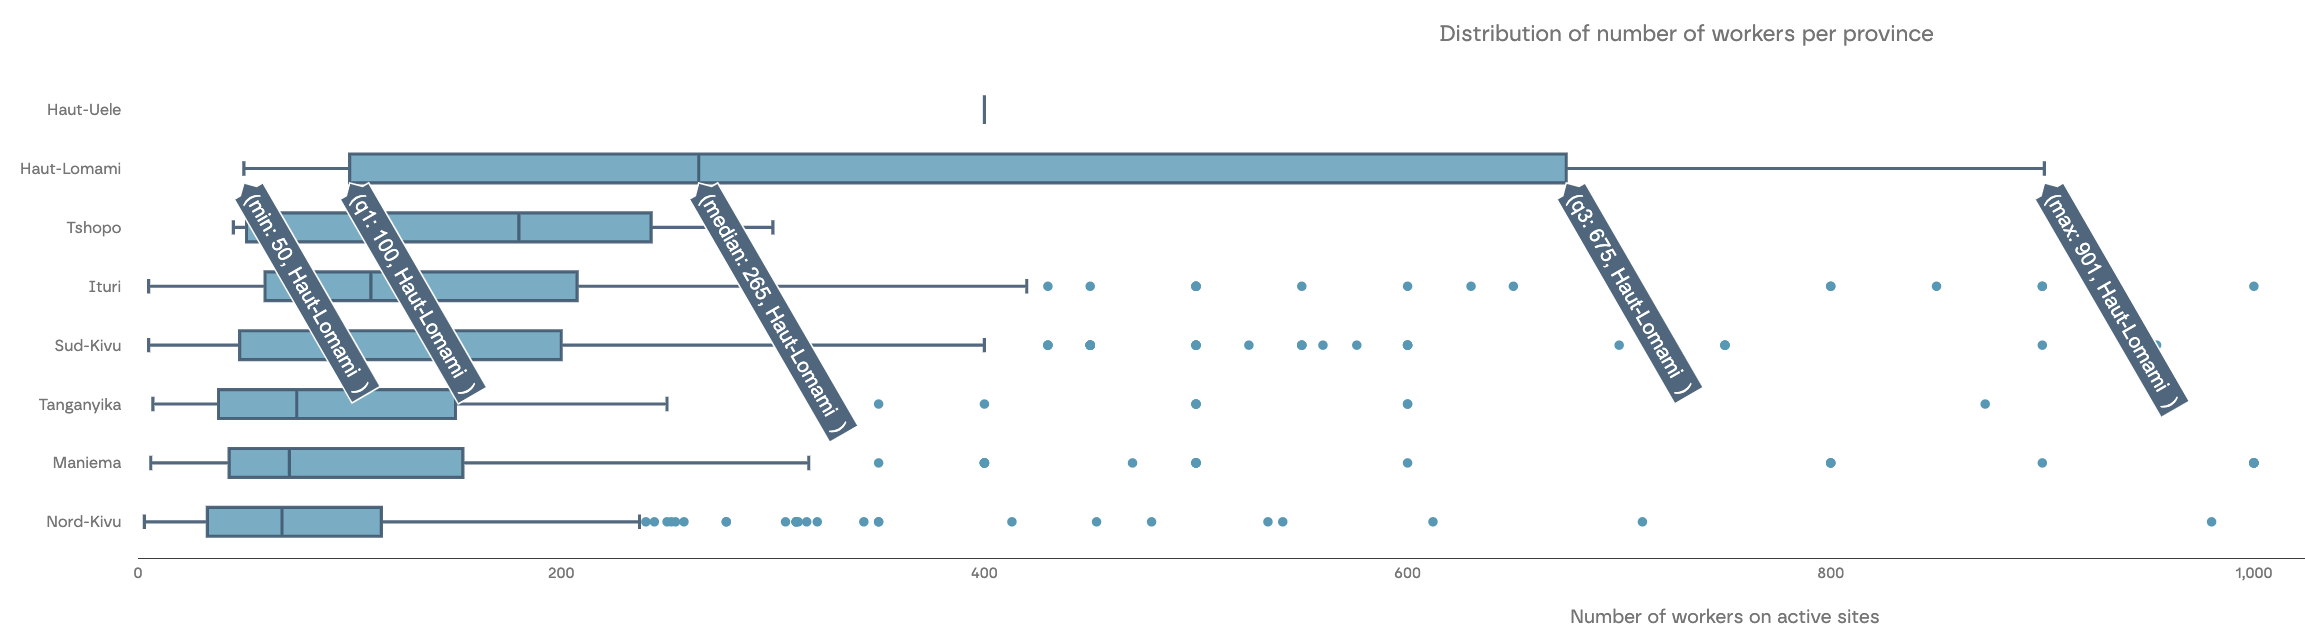
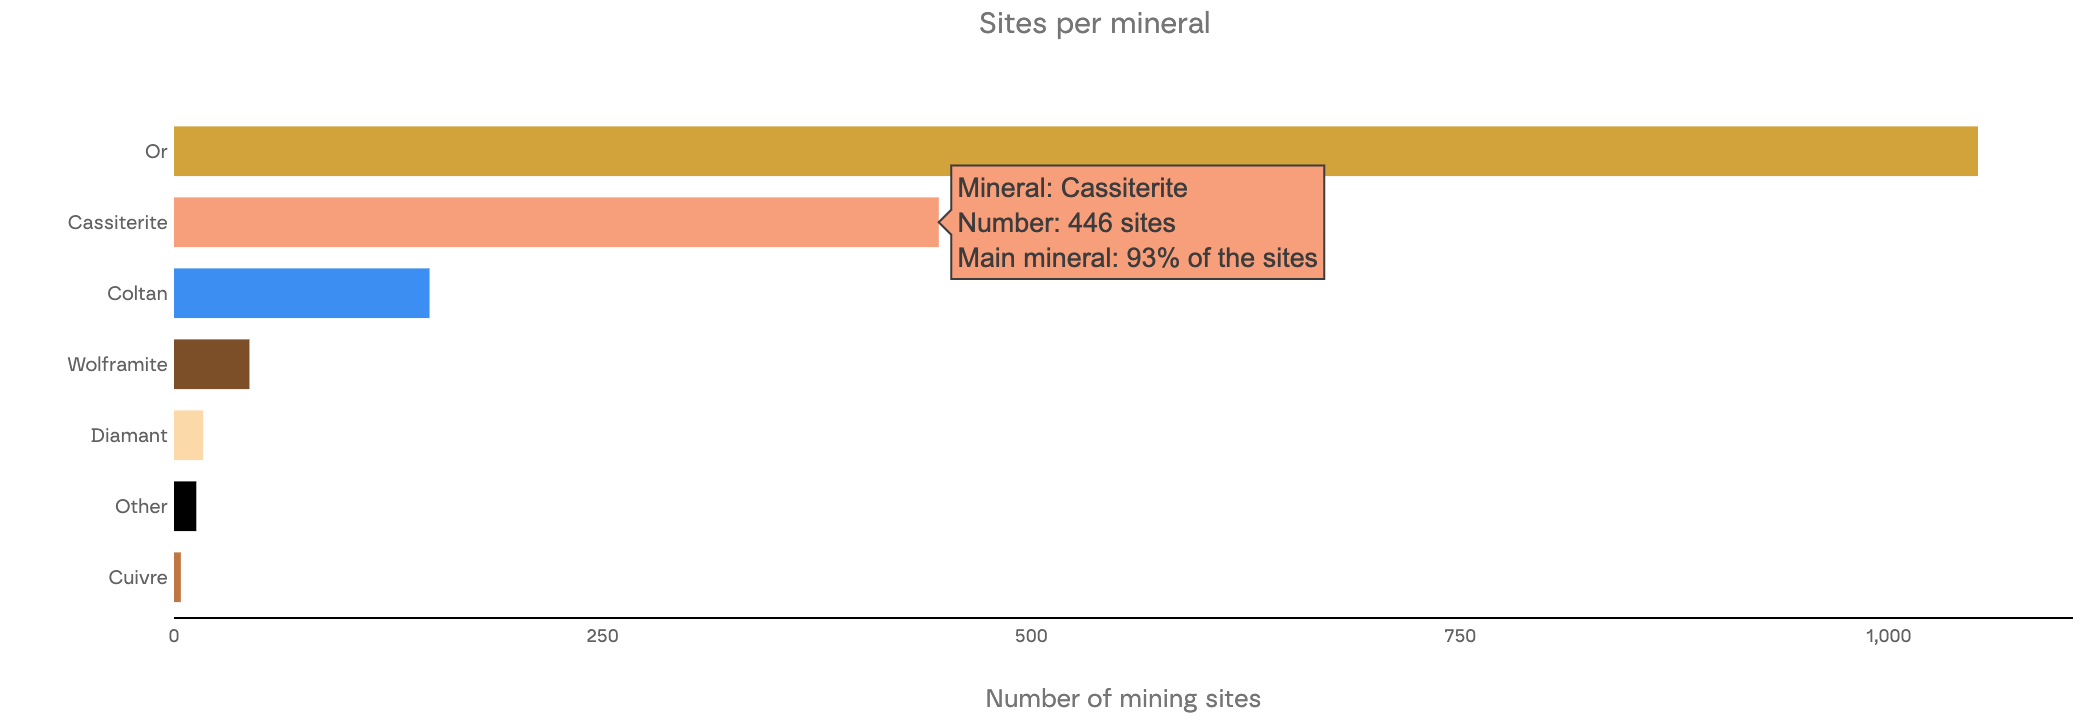
Figure 4. Additional information displayed when hovering the graphs. Top: boxplot on number of workers per province; bottom: number of mining sites for each mineral. Not that multiple minerals are regularly mined per site.
- The list of mining sites displayed on the map is available as an interactive Data table, which can be also downloaded as a csv file. This function allows users to export their own dataset after choosing their preferred filter combination.
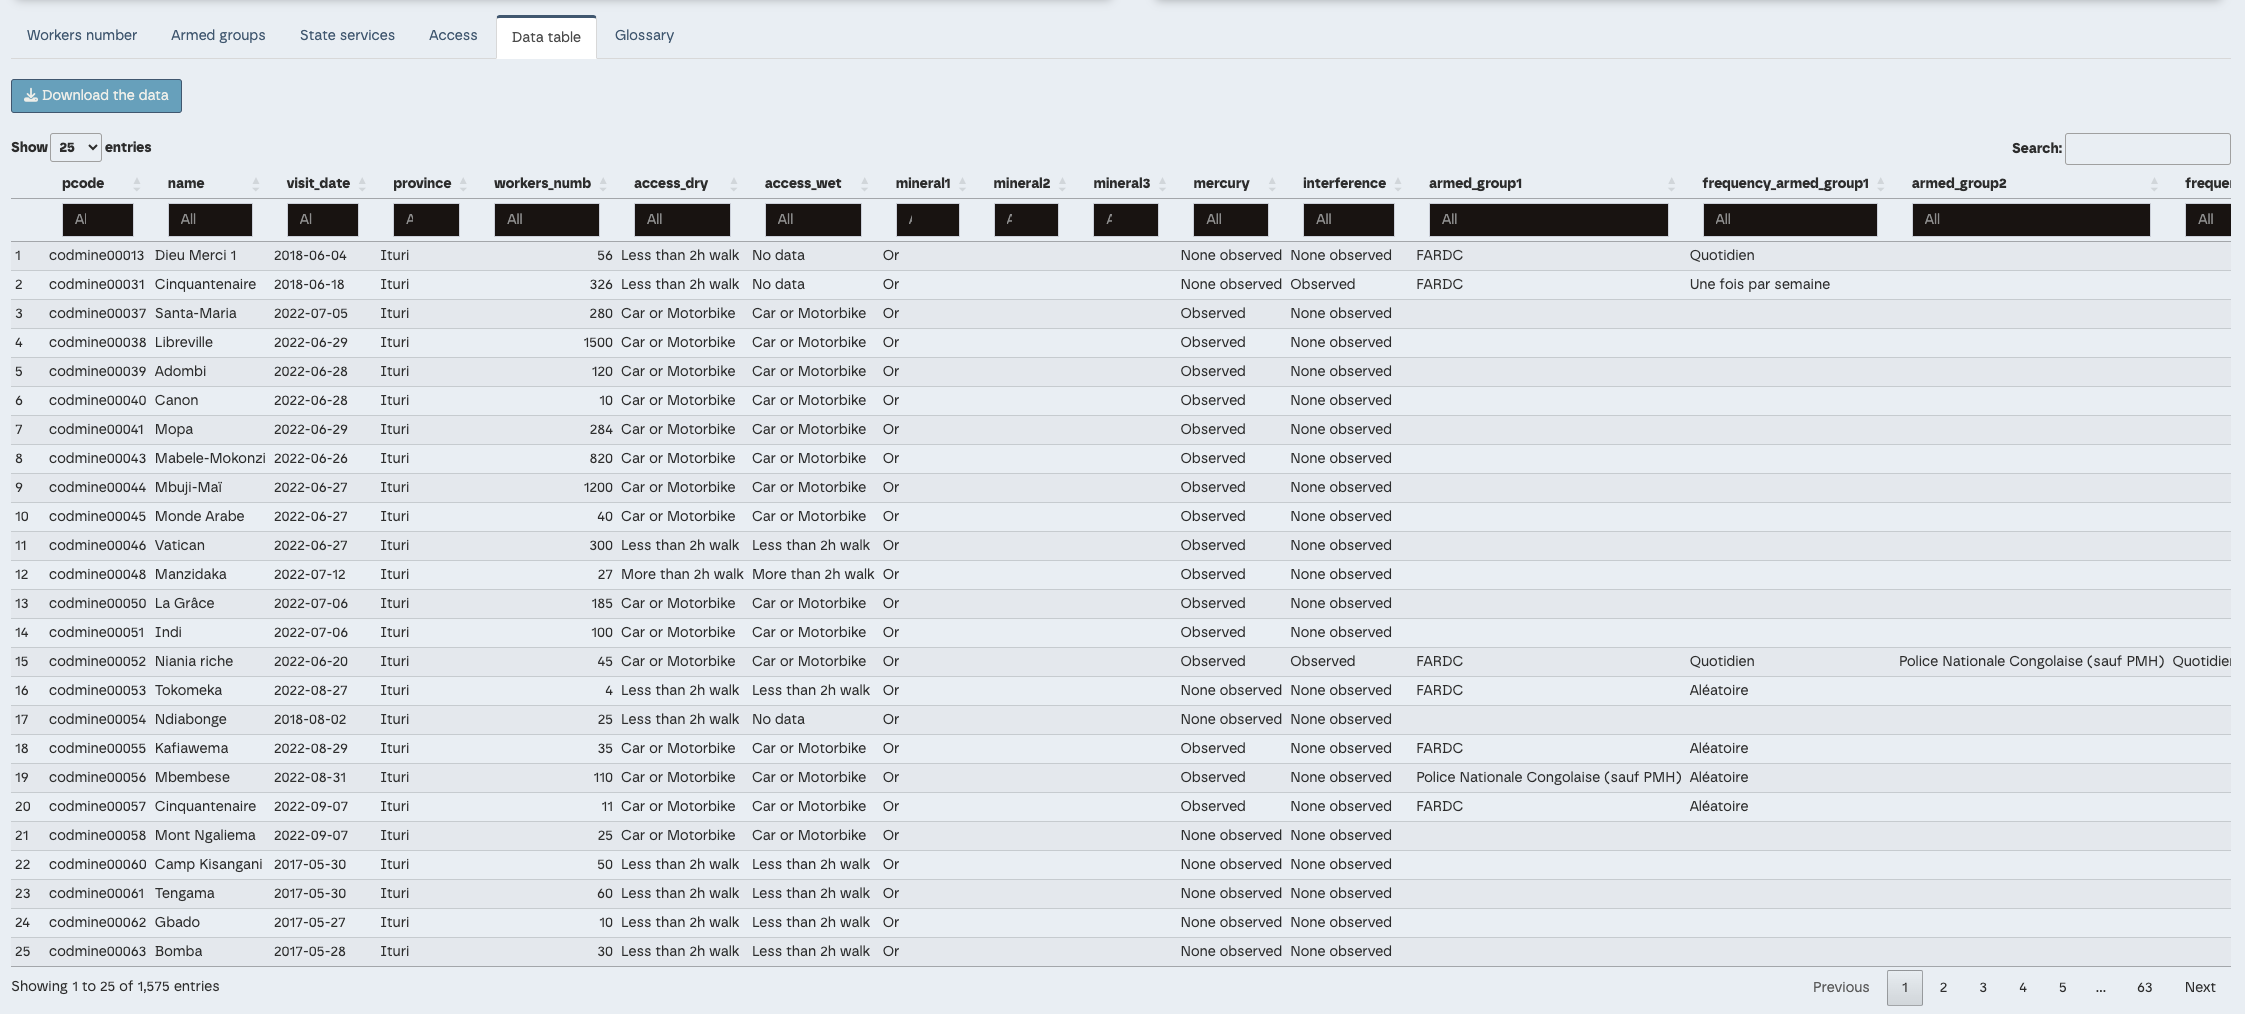
Figure 5. Data table. The list of the mining sites selecting by using the filters can be visualised in the Data table tab. This table can be downloaded as a csv file.
- A glossary is available to define the terminology used in the interactive dashboard
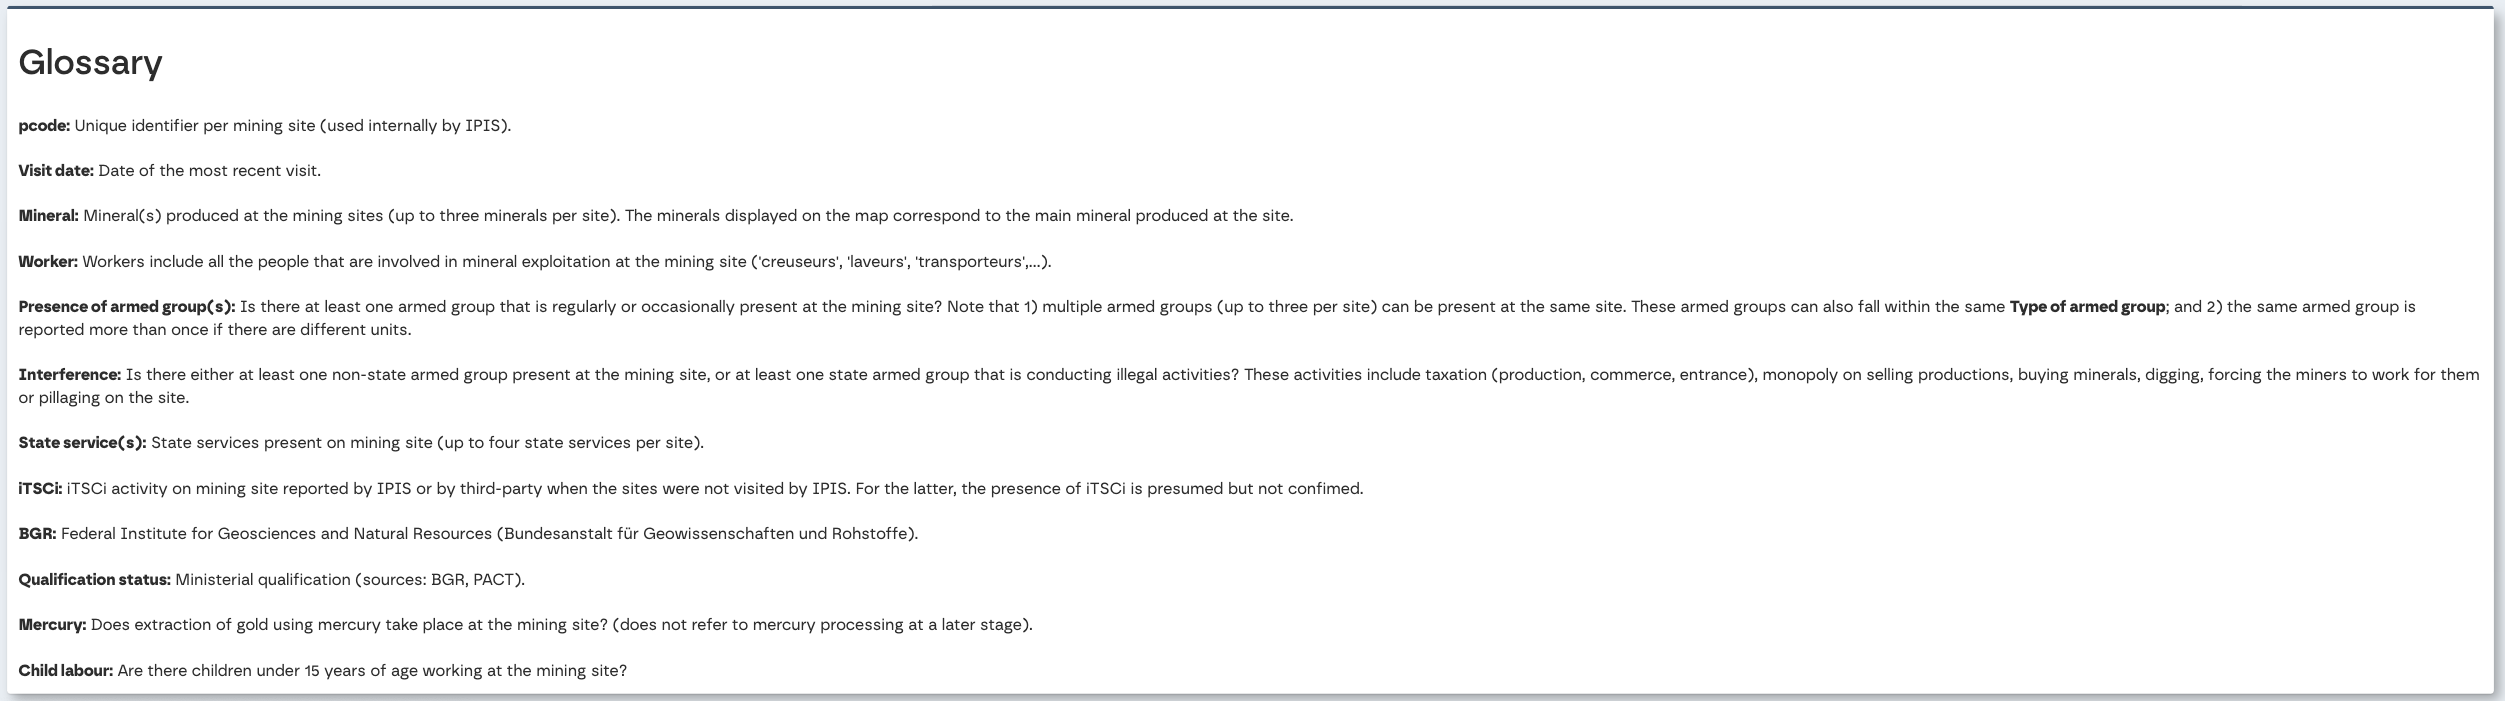
Figure 6. Glossary with key definitions.
Further information on IPIS Open Data are available here.
IPIS welcomes any feedback and questions on this dashboard and the Open Data via email.
This dashboard was developed with the help of our GIS Intern Alistair Steward.