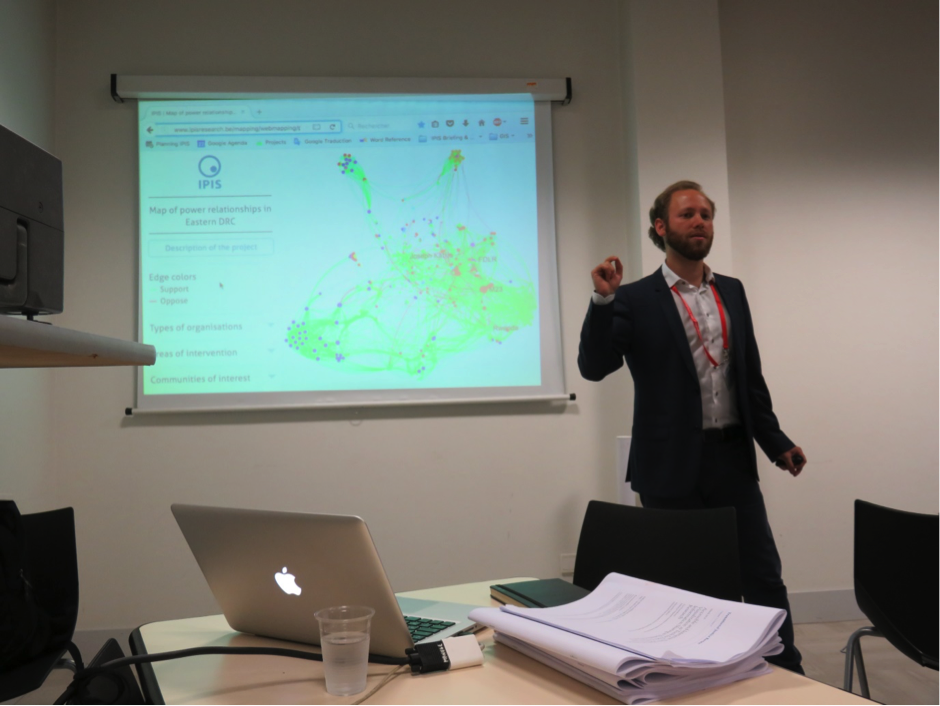
During the GeONG 2016 conference organised by CartONG in Chambery from 17th to 19th October, IPIS researcher AlexandreJaillon animated a workshop on Gephi, an open-source network visualisation tool, used by IPIS to display power relationships between key stakeholders in Eastern DRC.
IPIS uses Gephi, an interactive network visualisation tool, to map and visualize power dynamics in and post-conflict areas. The graph can be used to describe local, provincial, national, regional and international peace builders and spoilers and the relationships between these actors. The workshop presented how to use Gephi to create a power mapping visualisation that can help non-governmental and governmental actors understanding the underlying dynamics of a conflict or post-conflict situation.