Since 2009, the International Peace Information Service manages a database on mining site visits in eastern DR Congo. Since January 2017, IPIS publishes the data it has collected over the last decade on its Open Data page. This tutorial explains how to get started with the IPIS Open Data if you are using Microsoft Excel.
Other documentation to this data includes an Open Data FAQ & Dictionary page to help you understand the different columns and values present in our data, and an Open Data Tutorial to help advanced data analysts getting started using our Open Data for their own research using the statistical programming language R.
If you have questions or feedback on this page or our data, don’t hesitate to contact us
Loading the data in Excel
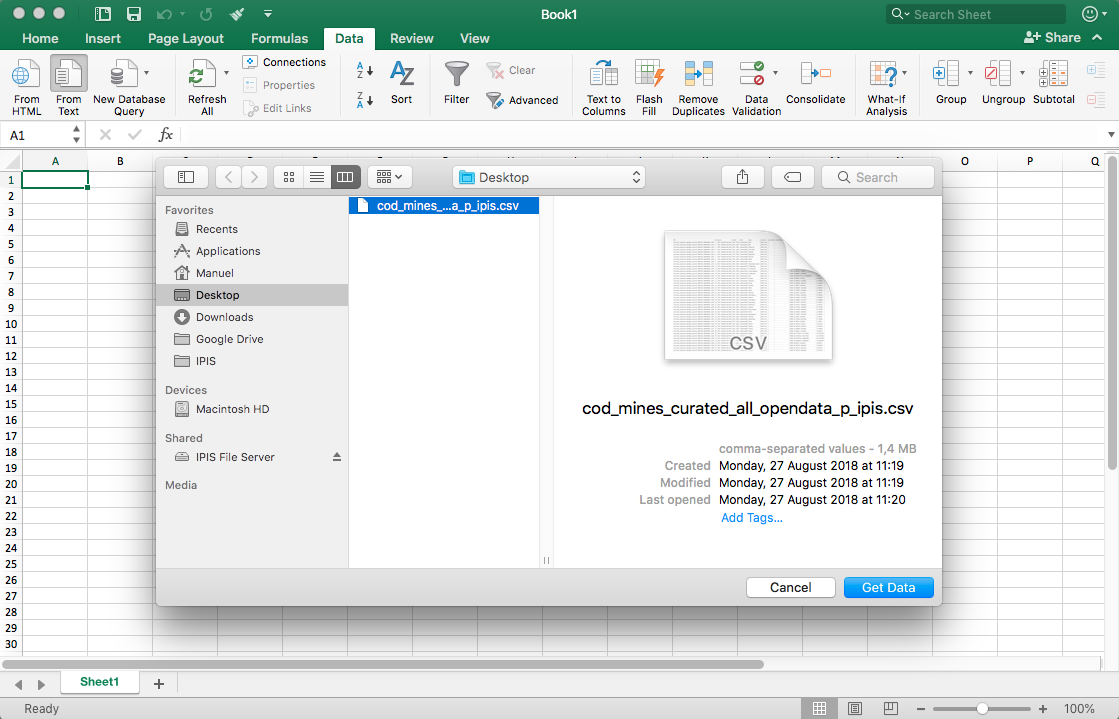
First, download the Open Data from our Open Data page as a Comma Separated Value (CSV) file, with a .csv extension. Sadly, it is not possible to download the data directly as an Excel Spreadsheet file with a .xls or .xlsx extension, but following explanation below will allow you to open the CSV file using Excel.
Open Excel and click Data > From text. Then localise the .csv file you downloaded and confirm.
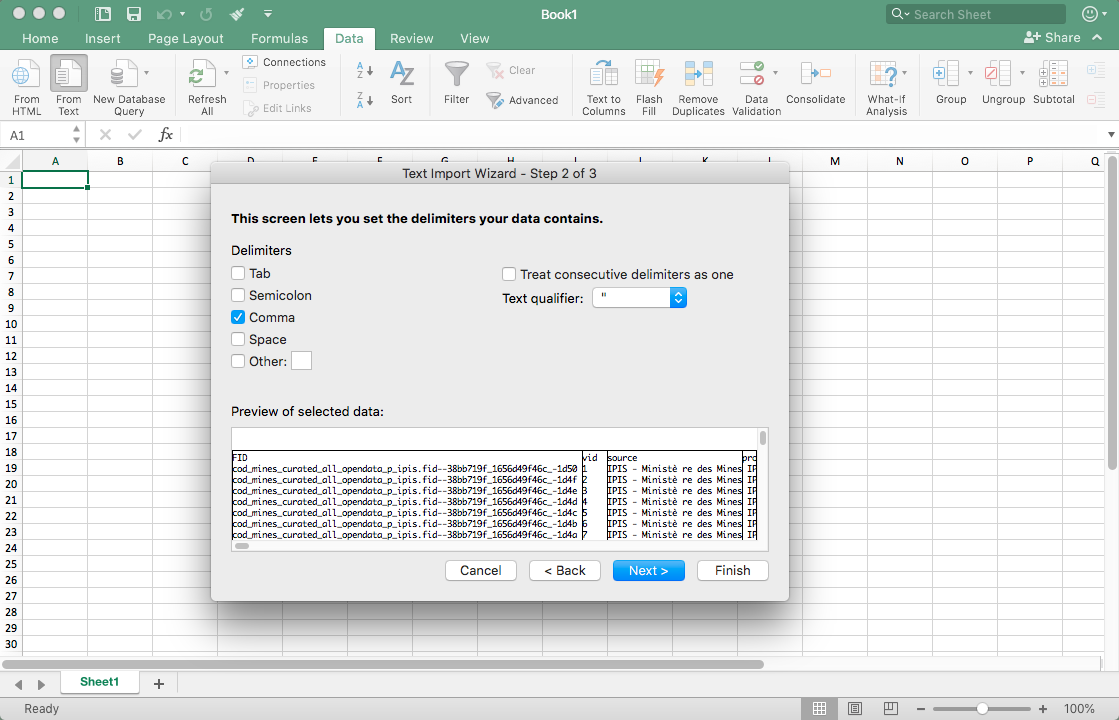
Excel will start its Text Import Wizard and ask you how it should interpret this file. First, check if it is interpreted as a Delimited file, and set the origin to Unicode (UTF-8) – this way all special characters are recognised. Then confirm.
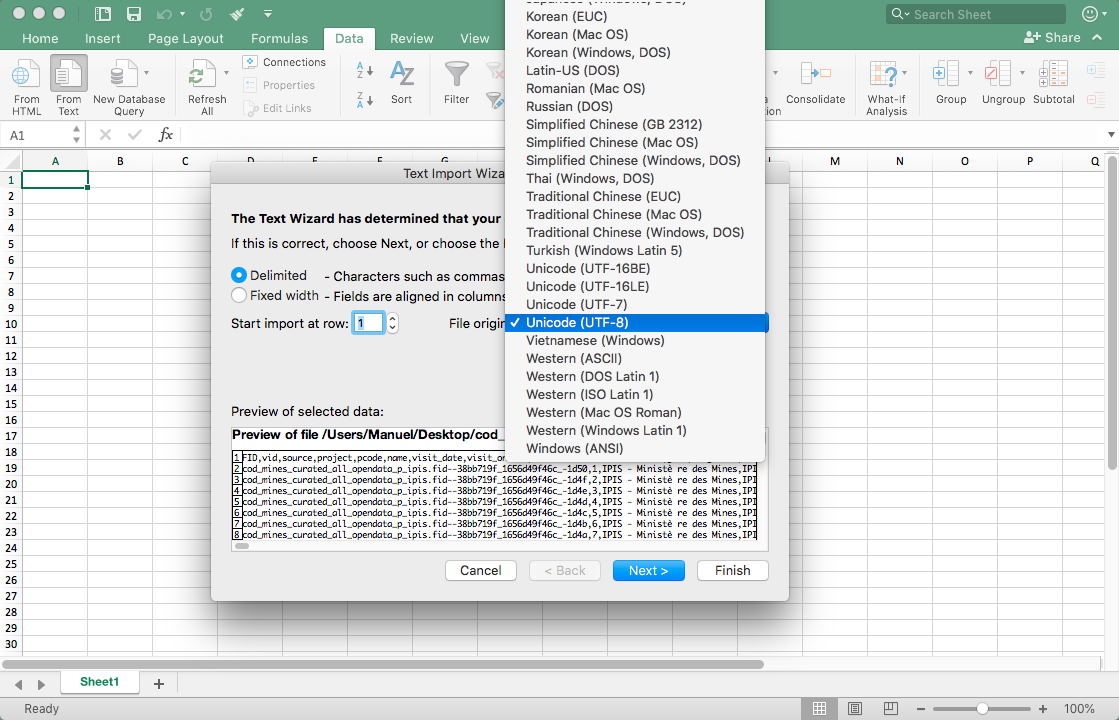
Now, set the delimiting character to Comma. The preview field below should now be showing the file’s content in columns.
On the next screen you are able to select the data format for each column. General should work well as a default, except on some systems for columns with decimal values, such as the longitude and latitude column. Scroll to the right until you find these columns, click on them (they are selected in black), and select the data format Text (even though they actually contain numbers). The top of the column should now say Text in stead of General.
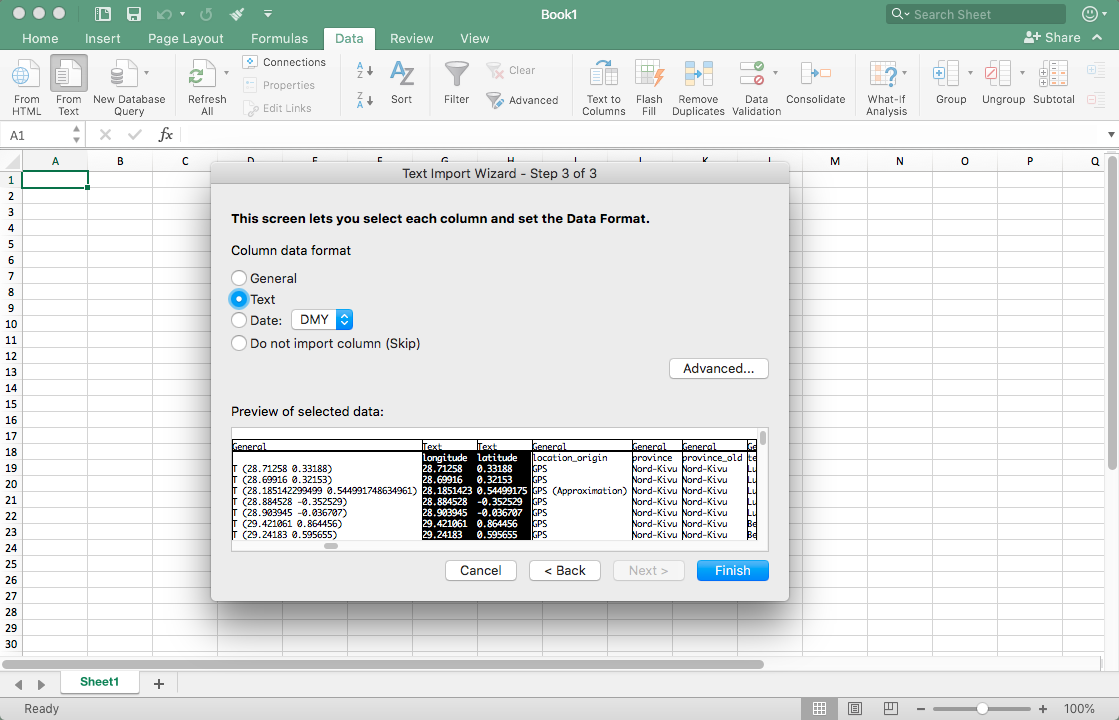
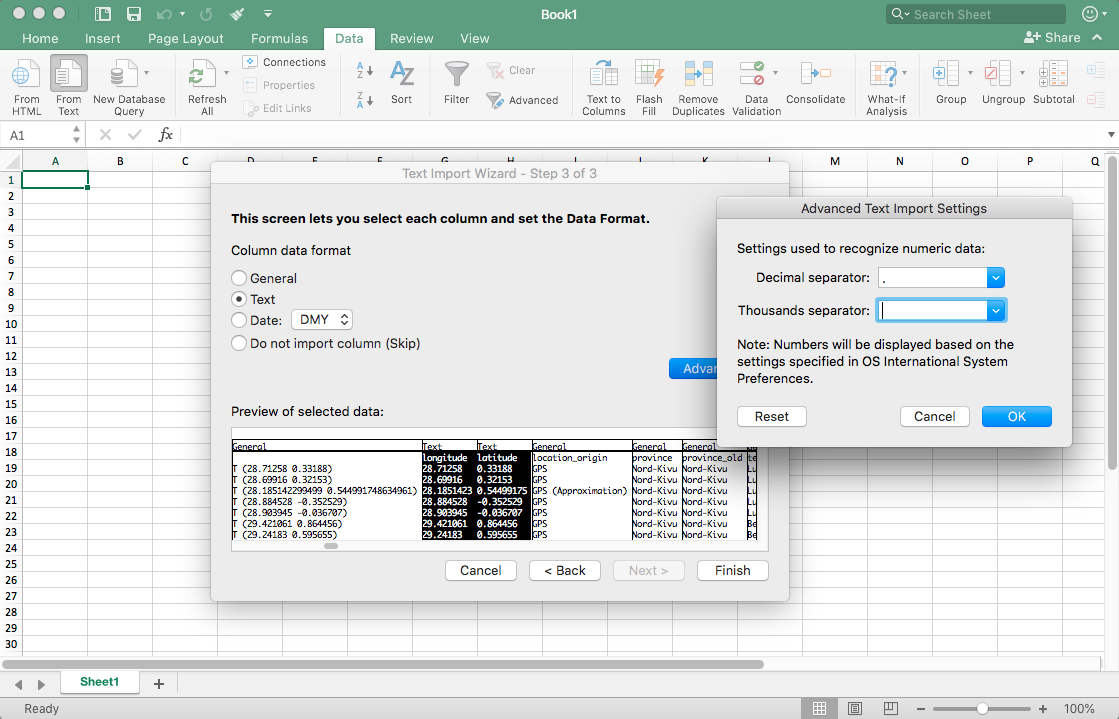
Using the Advanced button, set the decimal separator to . (a dot) and leave the box for the thousands separator empty.
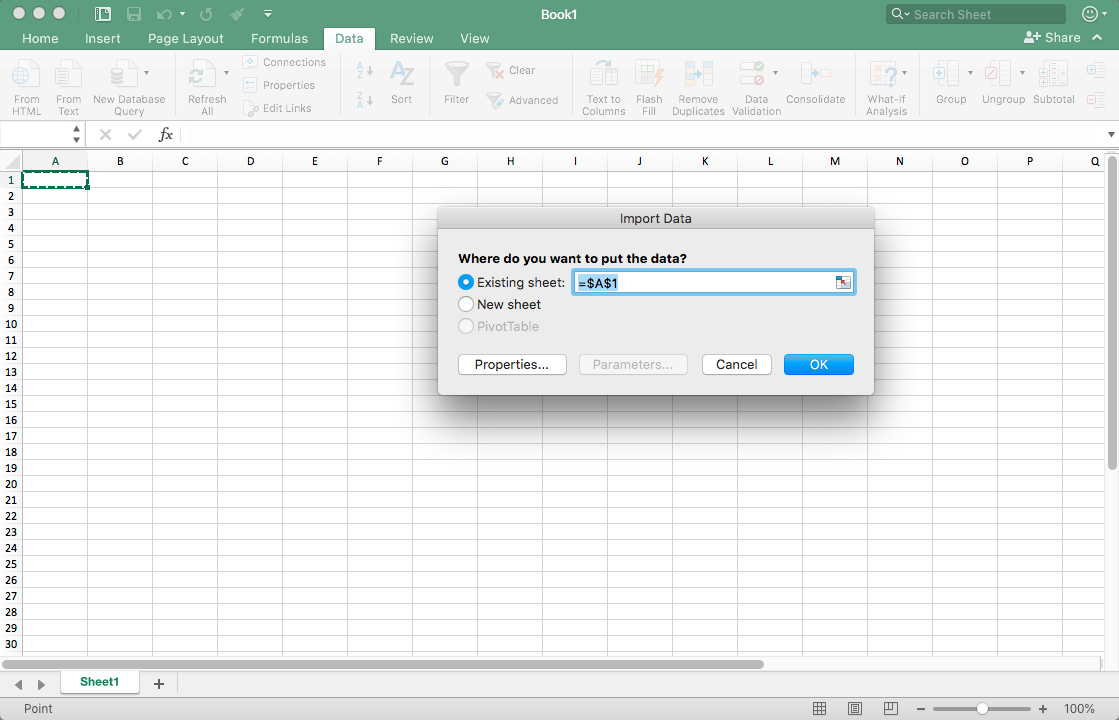
Confirm to load your data from the first cell A1 onwards.
The result should be a nice table with all data in it. Check if all columns were correctly separated, if special characters were recognised and if columns containing decimal values were interpreted correctly. If so, you can now save this file as a .xls or .xlsx file (e.g. data.xlsx), such that it will be opened using Excel when you work on it later or share it.
Creating a dataset containing only IPIS visits, and the most recent visit for each mine
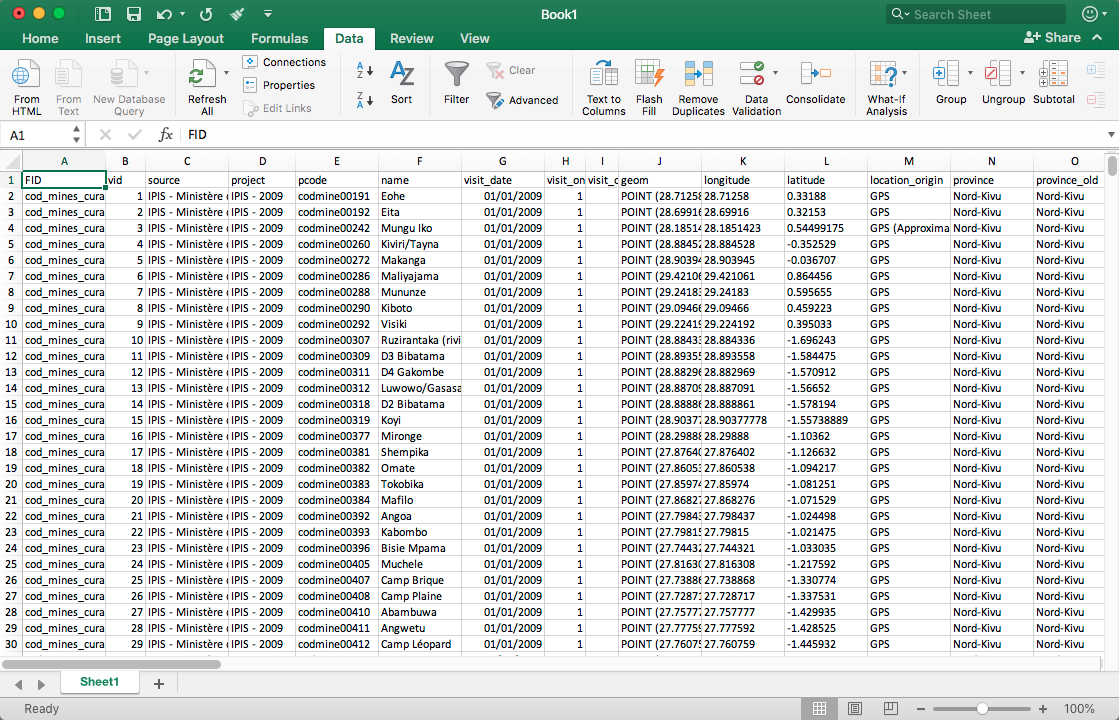
The Open Dataset contains one line per research visit that was done to a mining site. Sites that were visited multiple times are thus described in multiple lines – one line for each visit. Each visit is characterized by multiple columns. More information on these columns can be found in our Open Data FAQ & Dictionary page. There, you can learn that mines are uniquely identified using the pcode column.
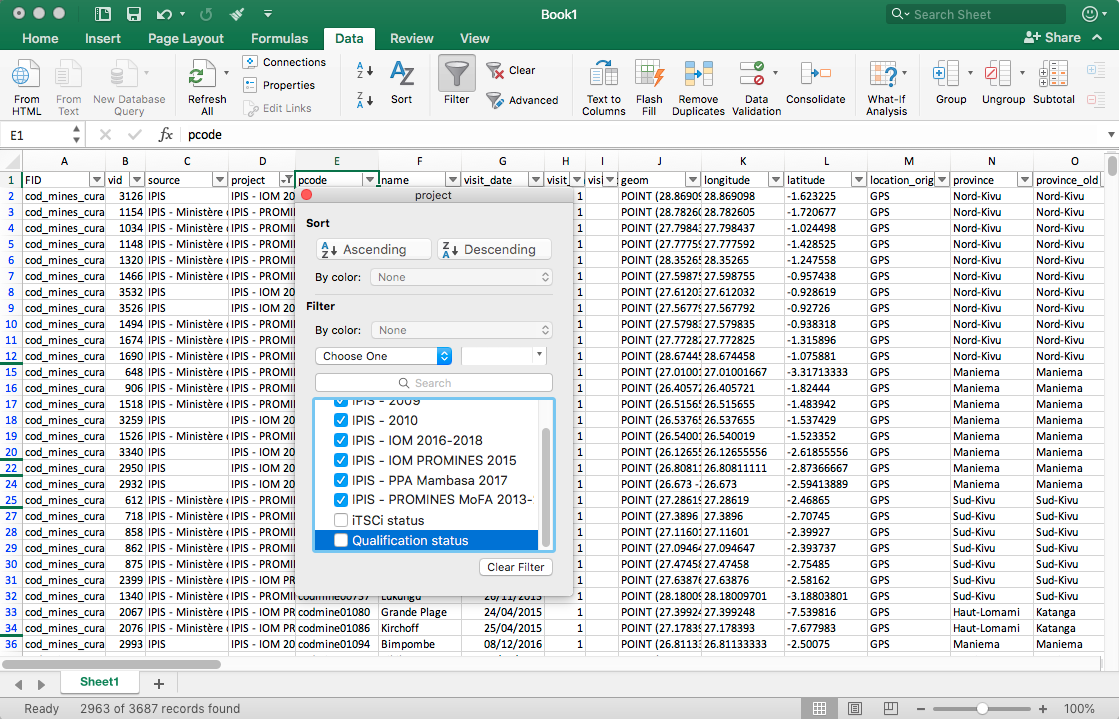
Some quick data exploration will reveal that there are three main categories of visits: visits by IPIS (and its partners), visits by qualification mission and extra iTSCi status info.
- IPIS visits are the most numerous and record data for all columns (with some exceptions as mentioned earlier).
- Qualification visits are the official record of mining site validations or ‘qualifications’ – an official procedure defined by the National Minister of Mines to certify mining sites as free of influence from armed groups using colored labels: green, yellow or red. During these visits data is collected in virtually all columns, with some exceptions (e.g. selling_points_mineral1 etc.).
- The iTSCi status info lines contain additional information on which sites apply iTSCi tagging – a system put in place by ITRI to make the trade of 3T minerals more transparent.
Dataset containing only IPIS visits
To create a dataset containing only IPIS visits, turn on the Filter options in Excel. Then, click on the drop down icon next to the project column and deselect all projects that don’t start with « IPIS ».
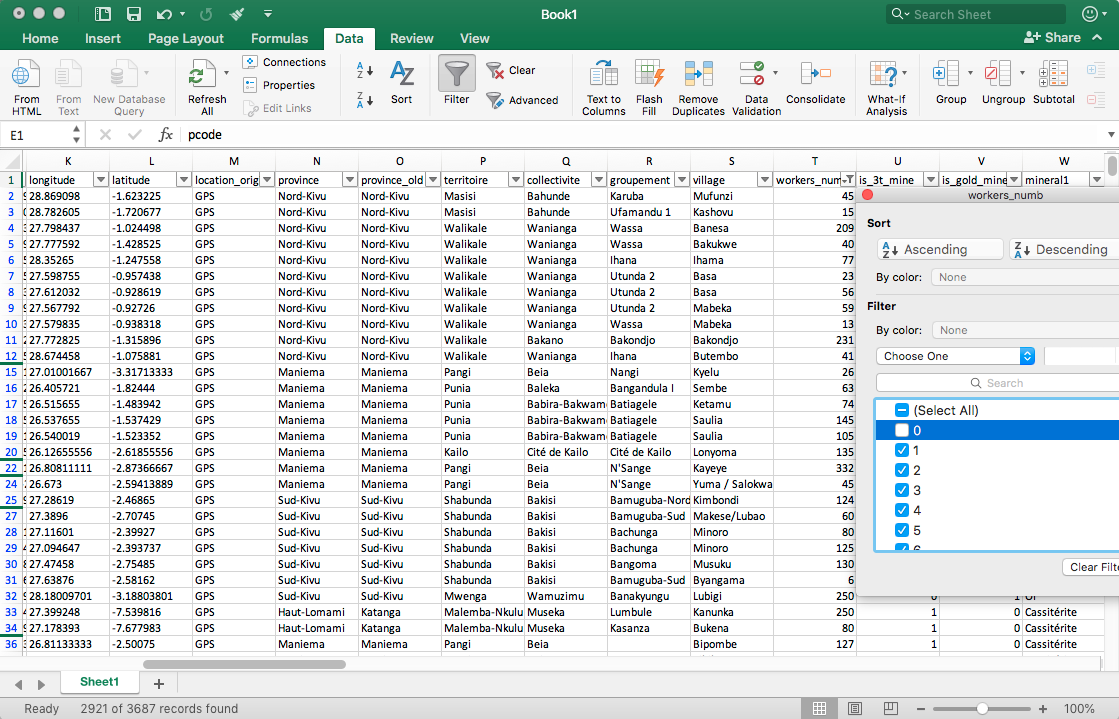
Dataset containing only active sites
Click on the drop down icon next to the workers_numb column and deselect the lines where workers_numb is ‘0′ or ‘(Blanks)’ – (which can be found at the end of the list). This way you keep visits to sites which were still in operation at the time of visit.
You should now only see the lines which correspond to these criteria. To continue, select all your cells, and paste them in a new blank document. This new document won’t contain the lines that didn’t correspond to your criteria, and only contains visits done by IPIS. Save it as a new document, for example data_ipis.xlsx. This is an important step as it ensures the unselected lines are dropped – so don’t skip this step!
Dataset containing only the most recent visits
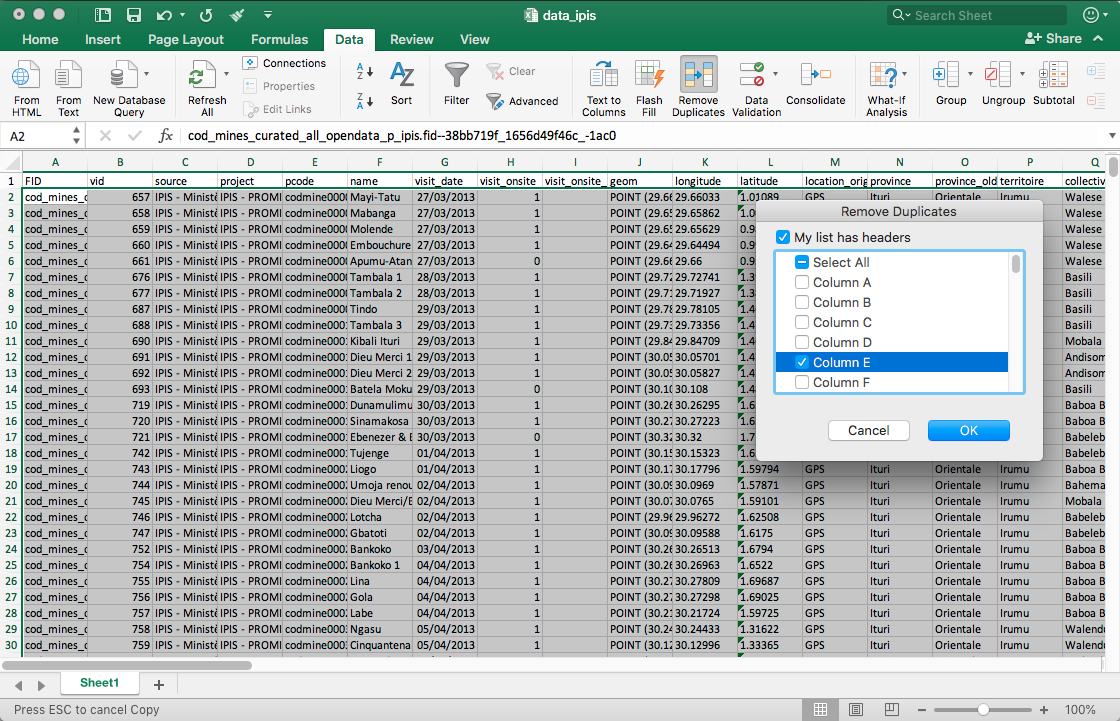
Now, we’ll remove the lines which are not the most recent visit to a specific mine. Remember that mines are uniquely identified by a value in the pcode column. First, we’ll use the Sort function to sort the lines alphabetically by pcode and by visit_date using Newest to Oldest. You’ll see that for some pcode values there are multiple entries, with the most recent one on top.

Then, we’ll use the Remove Duplicates function to remove lines when there’s more than one visit with the same pcode. In that case, Excel will keep the first line for each duplicated pcode. Due to our earlier sort, that will conveniently be the newest visit. To do this, click the Remove Duplicates function and only check the column corresponding to the pcodes.
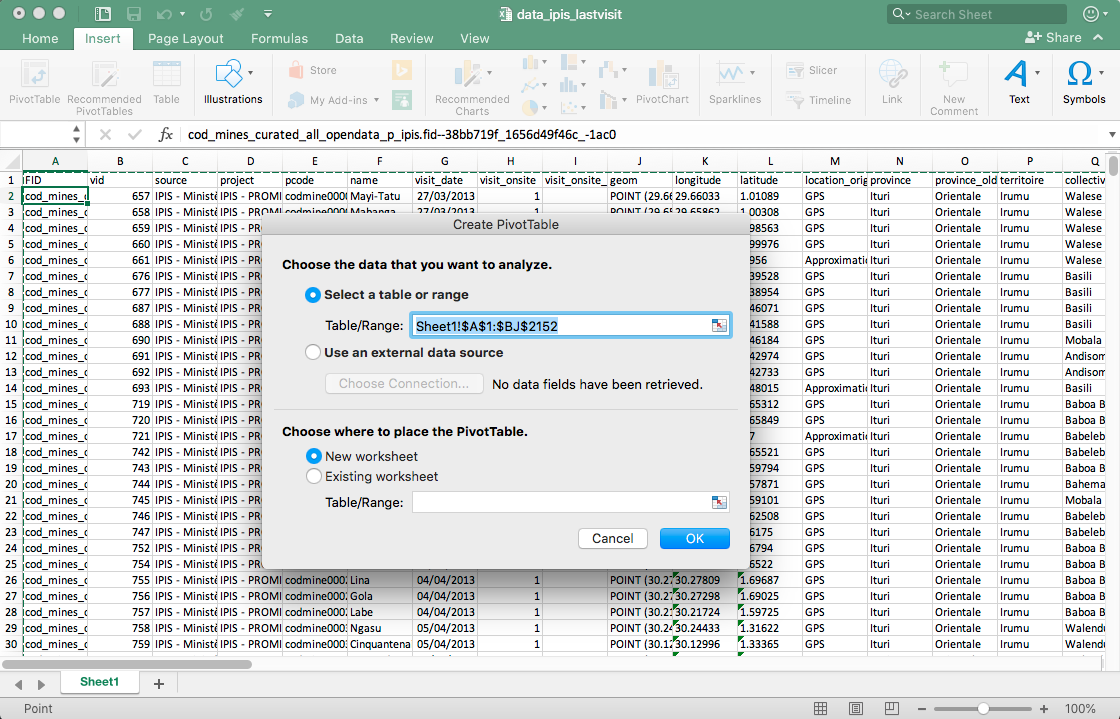
The result is a dataset with only visits done by IPIS (to mines that were active at the time of visit), and with only one line per mining site, containing information on its most recent visit. It’s again useful to save this result as a separate file, e.g. data_ipis_lastvisit.xlsx (no need to copy paste here). You can start your data exploration or statistics from this file, or share it with others.
Performing some basic statistics
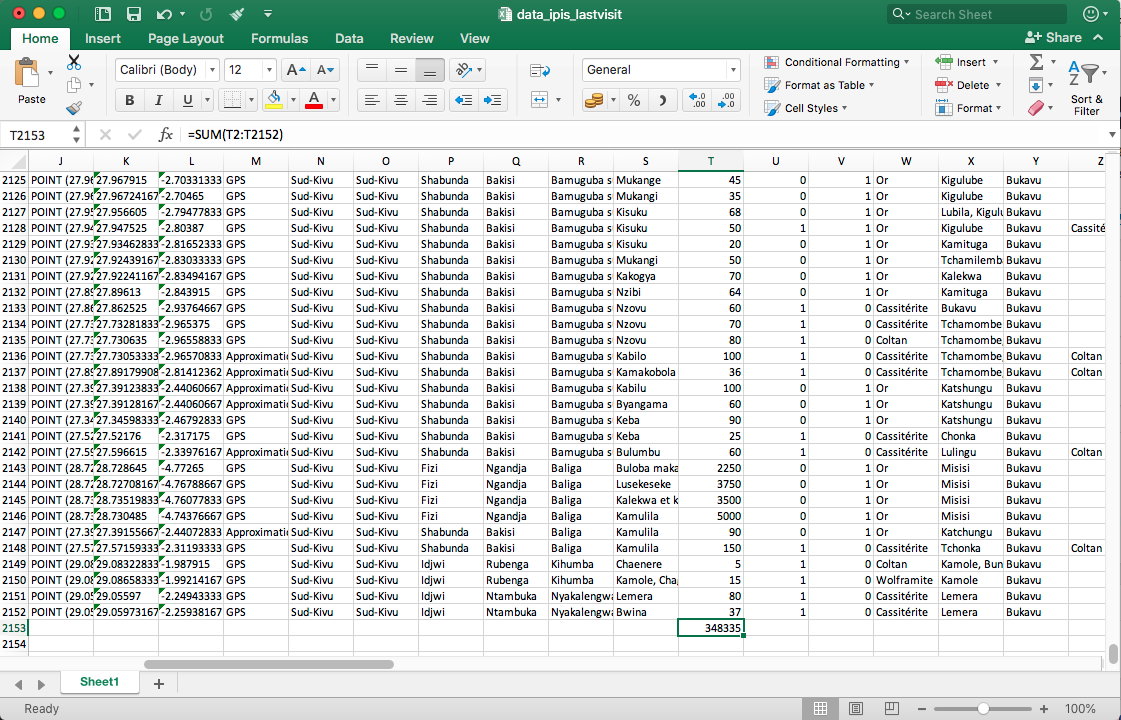
Now, you can do some basic statistics in Excel. The example below computes the total number of workers observed at mining sites of the entire dataset of most recent IPIS visits.
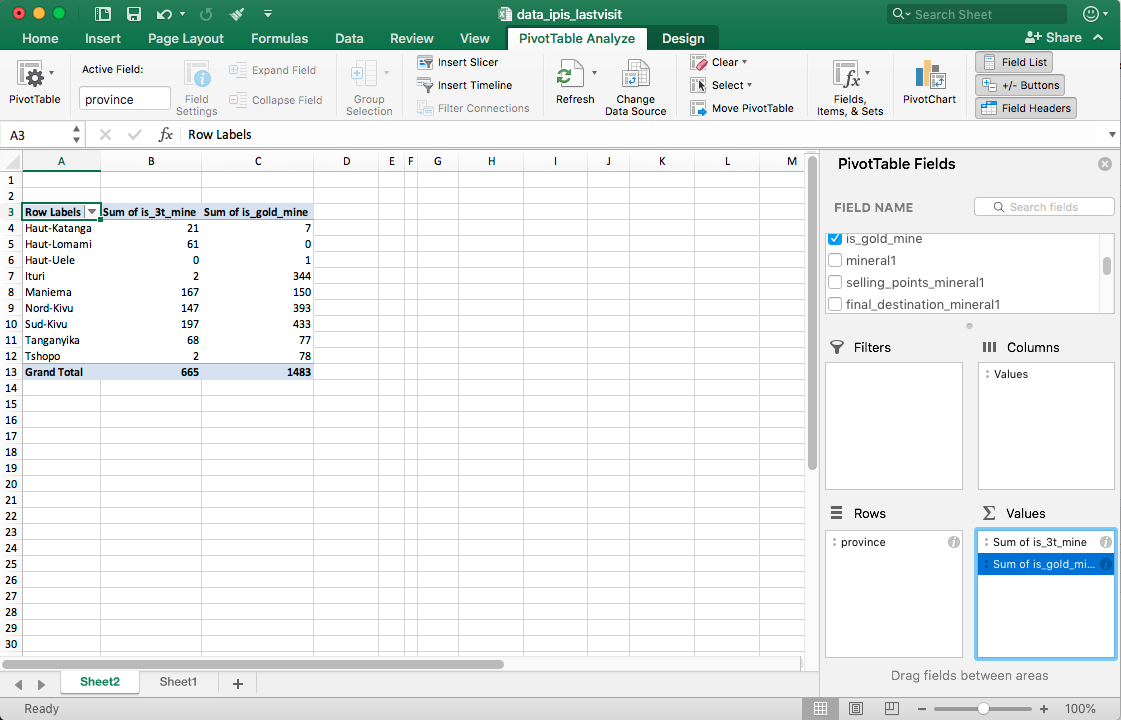
Another very useful option is to create a PivotTable. Below, it is used to count the number of 3T sites and gold sites per province.