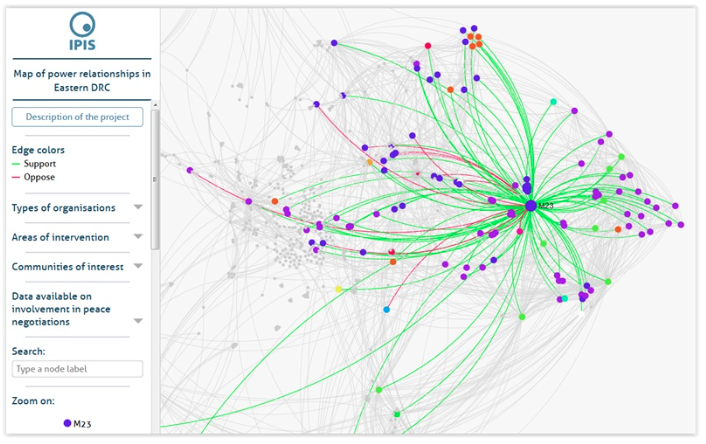
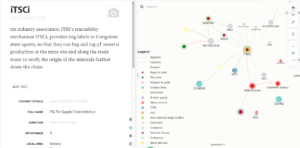
IPIS has developed a methodology to map stakeholders and power structures. Following an in depth study through interview and literature review, this approach uses modern visualisation techniques to create interactive tools that map and visualize the power dynamics in conflict and post-conflict areas. These tools can be used to describe local, provincial, national, regional and international peace builders and spoilers and the relationships between these actors.
A power mapping visualisation tool and table can help non-governmental and governmental actors understanding the underlying dynamics of a conflict or post-conflict situation. Understanding the local power structure is an essential step to engage in a new area.
The following screenshots are examples of recent power mappings:
Due to the nature of the data and the specific use of these tool, these power mappings are not publicly available and can not be shared readily. However, IPIS welcomes requests for power mapping projects tailored to your needs… Please contact us for more information.
Some IPIS Power Mapping Tool have been built with the support of Atelier Iceberg and Clément Levallois.


