Résumé français ci-dessous – French summary below
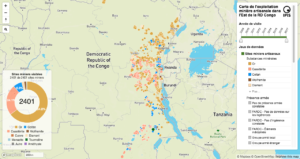
IPIS launched a major update of it’s DRC webmap displaying data on more than 2400 artisanal mining sites in eastern DRC and more than 800 roadblocks. Since December 2016, IPIS teams have visited more than 500 artisanal mines in eastern DRC, gathering data that has been added to IPIS’ interactive webmap. IPIS also integrated other datasets gathered during its projects in the region, including the data on roadblocks. To allow users an optimal acces to this new data, IPIS gave its webmap a major upgrade. Users will find the interaction with the map much faster and more intuitive than in previous versions. Additionally, IPIS has developed a useful tutorial to navigate the users through the Open Data that has been made available together with the map.
IPIS has collected data on artisanal mining sites since 2009, and made it publicly accessible on webmaps and in analytical reports. The upgraded map presents new mining sites, bringing the total to more than 2400 sites visited as recently as December 2017. New information on the mining sites has been included. A new layer has been added displaying hundreds of roadblocks. The latest update of the map has been supported by the International Organization for Migration (IOM) in the DRC, through the USAID funded Responsible Minerals Trade (RMT) project.
Later this year, an updated analytical report will be published on the most recent ASM data published on this interactive map. As new data is collected through ongoing projects, IPIS will regularly add more data to the map in the coming months.
Discover the webmap’s features

Examine mining sites and roadblocks
The upgraded map shows mines and roadblocks. Each feature can be further examined. Click on mines to learn more about the kind of minerals mined, the presence of armed groups – possibly engaging in specific illegal activities – or state services operating on the site. A picture has been added to the majority of the mines. A small pop-up allows you to deepen your search on selling points and roadblocks.

Filter your selection
Use the filter on the right end of the map to focus your research on specific types of mines or roadblocks. Mines can be filtered on general properties such as the minerals mined, the year it has been visited, or the presence of armed groups. More specific properties can also be used to filter, like the use of mercury for gold processing, or the validation status of the mine. Roadblocks can be filtered on the operator at the roadblock, or on the type of roadblocks.
 Count all filtered mines
A small graph in the lower left of the map shows the total number of mines that are selected by the current filters, and tells you how these are distributed over the various minerals. Use it in combination with the filters to investigate how prevalent certain mining site characteristics are.
 Search for specific features
A useful search function in the top left of the map allows you to search for specific mines, selling points, locations and more. A smooth zooming transition brings you straight to where you need to be!
 Discover the local trade flows
During its mining site visits, IPIS records the selling points and final destinations of the minerals sources at each site. Such data can be hard to understand when displayed in a tabular form. Lines drawn from mining sites to their respective selling points and the successive final destinations, visualise the trade flows in the region in a intelligible way. The use of different colours per actor allows you to reveal the interference of armed actors at the original mining site. Interesting patterns regarding the interference at each level of the mineral trade can be uncovered.
 Learn about the context
Extra layers such as mining concessions and protected areas help you understand the context in which the mining sites and roadblocks take place.
 Enjoy a snappier webmap experience
IPIS has rebuild its entire webmap with the latest webmapping technology. This version uses Mapbox GL to render the map live in your browser. Compared to our previous webmaps with raster tiles, this results in much faster maps, with nice extra’s such as 3D viewing, gracious zooming, beautiful layering and typography, and seamless switching between road and satellite basemaps. If you like this map and want a similar one for you own project, contact us!
 Digg deeper
If you want to look through the data behind the webmap in more details, you can! Some of the layers displayed on the webmap are available on the Open Data page.
The webmap has been developed with the support of the International Organization for Migration-IOM in the DRC through the United States Agency for International Development-USAID funded Responsible Minerals Trade (RMT) project.
Version française
IPIS lance une mise à jour majeure de sa carte interactive en RDC, qui affiche des données sur plus de 2400 sites miniers artisanaux et plus de 800 barrages routiers dans l’est du pays. Depuis décembre 2016, les équipes d’IPIS ont visité plus de 500 mines artisanales dans la région, collectant des données qui ont été ajoutées sur la carte interactive. IPIS a également intégré sur la carte d’autres jeux de données, y compris des données sur les barrages routiers. Pour offrir aux utilisateurs un accès optimal à ces nouvelles données, IPIS a décidé de mettre à jour sa carte interactive. Les utilisateurs apprécieront une interface bien plus rapide et plus intuitive comparée aux versions précédentes. De plus, IPIS a développé un tutoriel pour expliquer comment utiliser les données disponibles en Open Data.


